import pandas as pd
import seaborn as sns
df = pd.read_csv("c:\\data\\wisc_bc_data.csv")
# R과는 다르게 stringsAsFactors=T 안해줘도 된다
# DataFrame 확인
print(df.shape) # (569, 32) 행,열 확인
print(df.info()) # 데이터구조 확인
print(df.describe()) # 요약통계량 확인
# Dataframe 선택 연습
# dataframe[행][열] == dataframe[조건][컬럼명]
print(df.iloc[0:5, ]) # 0~4번째행
print(df.iloc[-5: ,]) # 끝에서 5번째 행 끝까지
# df.iloc을 이용하면 컬럼명이 없더라도 원하는 행을 선택할 수 있다
print(df.iloc[ :, [0,1] ]) #0,1번째열
print(df.iloc[ :, : ]) #전체열
#%%
# X = 전체 행, 마지막 열 제외한 모든 열 데이터 -> n차원 공간의 포인트
X = df.iloc[:, 2:].to_numpy() # 2번째 열부터 끝까지 전부 numpy로 변환
y = df['diagnosis'].to_numpy()
print(df.shape) # (569,32), numpy 변환 전
print(len(X)) # 569, numpy 변환 후
print(len(y)) # 569, numpy 변환 후
#데이터 정규화 수행
# 1. 스케일(scale) : 평균0, 표준편차1인 데이터로 정규화
# 2. min/max : 0~1 사이의 숫자로 변경
from sklearn import preprocessing
X=preprocessing.StandardScaler().fit(X).transform(X)
from sklearn.model_selection import train_test_split
# 훈련 데이터 70, 테스트 데이터 30으로 나눈다.
X_train, X_test, y_train, y_test = train_test_split(X,y,test_size =0.3, random_state = 10)
# random_state=10은 R에서 seed값 설정과 동일
print(X_train.shape) # (398, 30)
print(y_train.shape) # (398, )
#%%
# 스케일링(z-score 표준화 수행 결과 확인)
for col in range(4):
print(f'평균 = {X_train[:, col].mean()}, 표준편차= {X_train[:, col].std()}')
for col in range(4):
print(f'평균 = {X_test[:, col].mean()}, 표준편차= {X_test[:, col].std()}')
# 학습/예측(Training/Pradiction)
from sklearn.neighbors import KNeighborsClassifier
# k-NN 분류기를 생성
classifier = KNeighborsClassifier(n_neighbors=5) # k값 : 5
# 분류기 학습
classifier.fit(X_train, y_train)
# 예측
y_pred= classifier.predict(X_test)
print(y_pred)
# 모델 평가
from sklearn.metrics import confusion_matrix
conf_matrix= confusion_matrix(y_test, y_pred)
print(conf_matrix)
# 이원 교차표 보는 코드
from sklearn.metrics import classification_report
report = classification_report(y_test, y_pred)
print(report)
# 정확도 확인하는 코드
from sklearn.metrics import accuracy_score
accuracy = accuracy_score( y_test, y_pred)
print(accuracy)
# k에 따른 오류율 시각화
import numpy as np
errors = []
for i in range(1, 31):
knn = KNeighborsClassifier(n_neighbors = i)
knn.fit(X_train, y_train)
pred_i = knn.predict(X_test)
errors.append(np.mean(pred_i != y_test))
print(errors)
import matplotlib.pyplot as plt
plt.plot(range(1, 31), errors, marker='o')
plt.title('Mean error with K-Value')
plt.xlabel('k-value')
plt.ylabel('mean error')
plt.show()

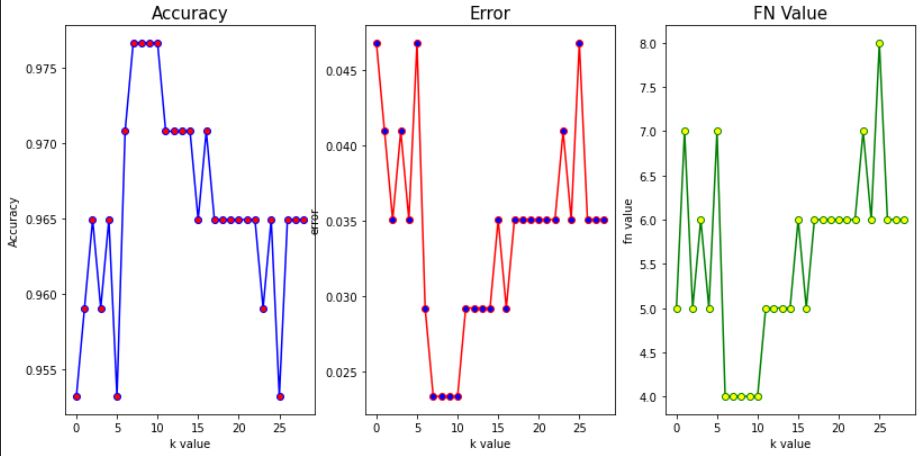
# 그렇지만 유방암 예측모델 같은 경우 정확도보다 FN이 더 중요한 지표일수도 있다
# 암인데 암이 아니라고 진단해버리는 것이 더 치명적인 손실이기 때문
# 정확도, 에러율, FN Value 기준 시각화
import matplotlib.pyplot as plt
from sklearn.neighbors import KNeighborsClassifier
from sklearn.model_selection import train_test_split
from sklearn import metrics
import numpy as np
acclist = []
err_list = []
fn_list = []
for i in range(1,30):
knn = KNeighborsClassifier(n_neighbors=i)
knn.fit(X_train, y_train)
y_pred = knn.predict(X_test)
tn, fp, fn, tp = metrics.confusion_matrix(y_test, y_pred).ravel() # ravel 함수를 사용하면 직접 뽑아낼수 있다
fn_list.append(fn)
acclist.append(accuracy_score(y_test, y_pred))
err_list.append(np.mean(y_pred != y_test))
print(f'k : {i} , acc : {accuracy_score(y_test, y_pred)} , FN : {fn}')

# 그래프 사이즈, 위치 조정
plt.figure(figsize=(12,6))
plt.subplots_adjust(left=0.125,
bottom=0.1,
right=1,
top=0.9,
wspace=0.2,
hspace=0.35)
plt.subplot(131)
plt.plot(acclist,color='blue', marker='o', markerfacecolor='red')
plt.title('Accuracy', size=15)
plt.xlabel("k value")
plt.ylabel('Accuracy')
plt.subplot(132)
plt.plot(err_list, color='red', marker='o', markerfacecolor='blue')
plt.title('Error', size=15)
plt.xlabel("k value")
plt.ylabel('error')
plt.subplot(133)
plt.plot(fn_list, color='green', marker='o', markerfacecolor='yellow')
plt.title('FN Value', size=15)
plt.xlabel("k value")
plt.ylabel('fn value')
plt.show()
# 정확도 높이기 (min/max 정규화 사용해보기)
-> min/max 정규화를 사용한다고 무작정 높아진다는 보장은 없으나 영향이 있을 수 있으니 확인해본다는 느낌
k=12로 했을 때, 정확도가 0.9707602339181286로 가장 높게 측정된다.
이보다 더 높여보자
import pandas as pd
df = pd.read_csv("c:\\data\\wisc_bc_data.csv")
X = df.iloc[:, 2:].to_numpy() # 2번째 열부터 끝까지 전부 numpy로 변환
y = df['diagnosis'].to_numpy()
# 데이터 정규화 수행 - min/max
from sklearn import preprocessing
X=preprocessing.MinMaxScaler().fit(X).transform(X) # 위 부분만 수정하면 된다
from sklearn.model_selection import train_test_split
# 훈련 데이터 70, 테스트 데이터 30으로 나눈다.
X_train, X_test, y_train, y_test = train_test_split(X,y,test_size =0.3, random_state = 10)
# 학습/예측(Training/Pradiction)
from sklearn.neighbors import KNeighborsClassifier
from sklearn.model_selection import train_test_split
import numpy as np
from sklearn.metrics import accuracy_score
# k-NN 분류기를 생성
acclist = []
err_list = []
for i in range(1,30):
knn = KNeighborsClassifier(n_neighbors=i)
knn.fit(X_train, y_train)
y_pred = knn.predict(X_test)
acclist.append(accuracy_score(y_test, y_pred))
err_list.append(np.mean(y_pred != y_test))
print(f'k : {i} , acc : {accuracy_score(y_test, y_pred)}')

다음과 같이 k 값에 따른 정확도를 확인해보면,
정확도가 0.9883040935672515 로 오른 것을 확인할 수 있다.
0.9707602339181286 -> 0.9883040935672515
'나 취준생 > 파이썬' 카테고리의 다른 글
| 파이썬 의사결정트리 (0) | 2021.02.23 |
|---|---|
| 파이썬 나이브 베이즈 (0) | 2021.02.22 |
| 카카오 비밀지도 (0) | 2020.12.28 |
| 자카드 유사도 + 카카오 문제 (0) | 2020.12.24 |
| LRU 알고리즘 + 카카오 문제 (0) | 2020.12.23 |

